


Using Math to Rank All US Cities by Sports (Part 1)

I’ve always enjoyed thinking about the cities that have gone through pure treachery, watching the worst teams in a league play pointless games that are all towards a goal of a high draft pick. For instance, when the MLB is in its offseason, how on earth can a Houston native live with the Texans and the Rockets? How have Detroit fans coped with the Pistons, Lions, Tigers, and Red Wings stinking up the city for the last five years? On the flip side, I think about how spoiled all my Bostonian friends are to be able to support four of the greatest franchises in their sport’s history. At the same time, I am lucky to have a consistently successful, well-built Ravens team that blocks out the regular stupidity and failure of the Orioles organization.
I wanted to dig deeper than wins and losses though, so I put together this massive project that uses math to rank 36 cities from the Big 4 Sports Leagues (NBA, NFL, MLB, and NHL) Here’s how I did it.
First, it’s important to note a few things.
These rankings are based on sports since 2010.
They are as of January 21st, 2023. That’s how long I’ve been working on this.
Most NBA teams were 46 or 47 games in the season, and most NHL games were 39 or 40 games in. Any regular season games after that date were not considered. However, championships were updated, meaning Denver and Las Vegas have their championships in these rankings.
The same goes for NFL, whose season had a few playoff weeks left on January 21st.
None of the 2023 MLB season was counted.
To be part of the rankings, a city must have had at least two sports teams since 2010.
There are four categories of success that I considered. They are overall win percentage, championships won, best seasons, and best players.
For win percentage, I first found the total wins, losses, and ties for a team. However, since baseball has a 162 game season, and football is only 17 games, I had to find a way to balance out every sport so it had the same weight towards the win percentage. So, I came up with win percentage constants for each sport. They are the following numbers.
a. NBA = 1.3089
b. NFL = 6.1920
c. MLB = 0.6487
d. NHL = 1.3567
Here are the steps to finding those numbers.
Average the total number of games played by teams in a season in each league since 2010 (NBA = 76.40, NFL = 16.15, MLB = 154.15, NHL = 73.71).
Divide 100 by those averages.
But what did I do with these numbers? I multiplied a team’s wins, losses, and ties by the constant corresponding to their sport, producing a total number of 1300 games played by each team. Then, I combined all of wins, losses, and ties by a franchise and divided the totals by 1300 x the # of teams in the city. This gave me a city’s final win percentage.
One final note about win percentage: Hockey uses points percentage as opposed to win percentage, which means the league average is higher than 0.500. I calculated the average points percentages for every team in the last five years, and got a value of 55.28%. This corresponds to 718.64/1300 wins. So, for every city that had no NHL team, I would add this 718.64/1300 to the final sum of games. This creates an adjusted win percentage, and it’s why there are more teams with an adjusted win percentage over 0.500 than below.
For championships, I simply ranked by how many championships a team had since 2010. If teams were tied, which, of course, many were, a team with three finals appearances and two conference finals appearances would be ranked higher than a team with one finals appearance.
For great seasons and great players, I ranked them based on my own opinions. This was the only non-mathematically determined part of the process.
To implement a quantitative value to rank championships, great seasons, and great players, here’s what I did. The highest total win percentage by a team was 0.613. The lowest was 0.429. The difference in those win percentages divided by 36 is 0.0052. Therefore, for every team in any of the championships, great players, or great seasons rankings, their assigned win percentages decrease by 0.0052 per ranking.
For example, the 1st place team in the rankings would earn an assigned win percentage of 0.613, the 2nd place team would earn 0.6078, and the 3rd place team would earn 0.6026.
The final step of the process was finding which of the four categories had the most importance. I took a poll from 15 people, asking them to rank the categories’ importance from 1 to 4 with 1 being the least important and 4 being the most. Here were the results.
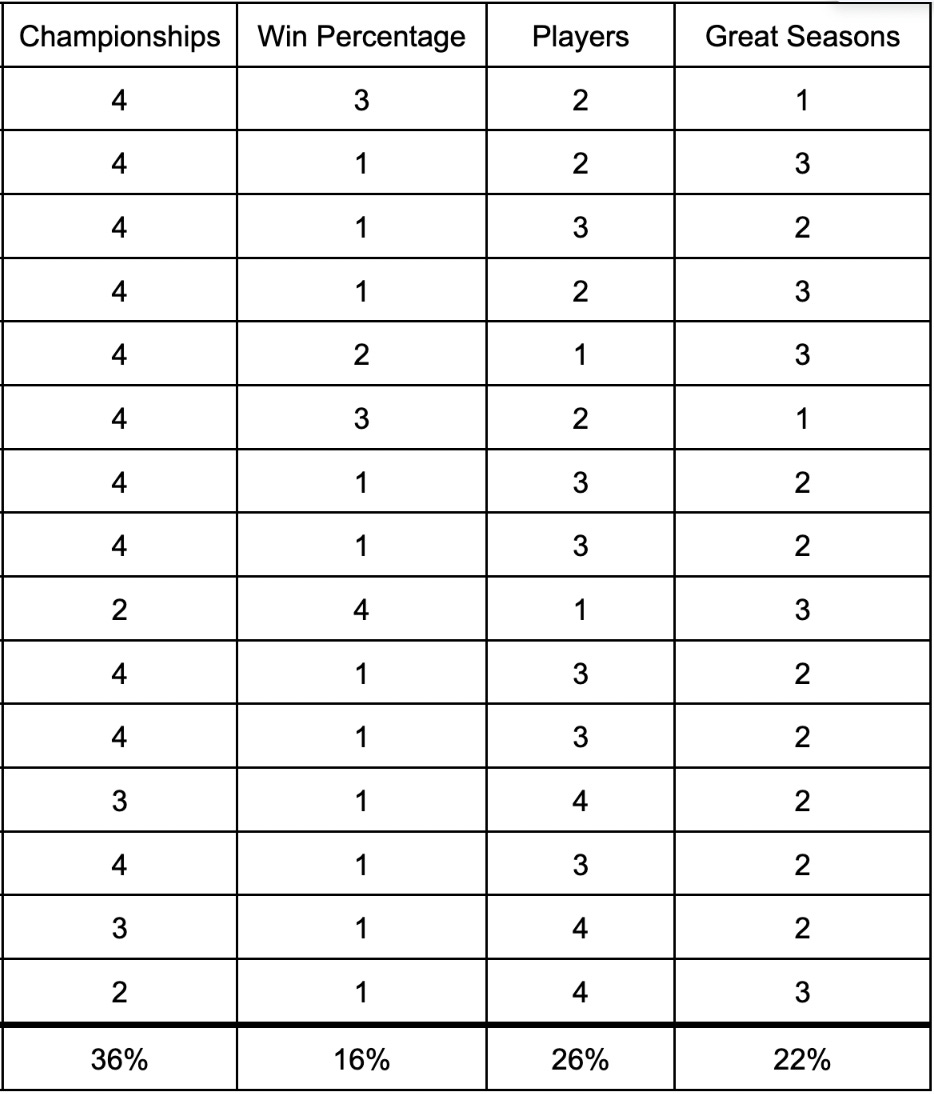
Using this data, I multiplied these percentages by cities’ win percentages in each category.
For example, Miami has an assigned win percentage of of 0.5714 for championships, so I would multiply 0.5714 by 36.
I did this for every category and every city, and summed the values for each city. That number appears next to each team’s ranking. So, after months of tedious calculations and research, I put together the final rankings.
36. San Diego (44.77)
Chargers, Padres
Record (27th): Chargers (51-61), Padres (944-1060)
Championships (33rd): Chargers (None), Padres (None)
Great Seasons (36th): Chargers (2013: 9-7, DR), Padres (2022: 89-73, NLCS)
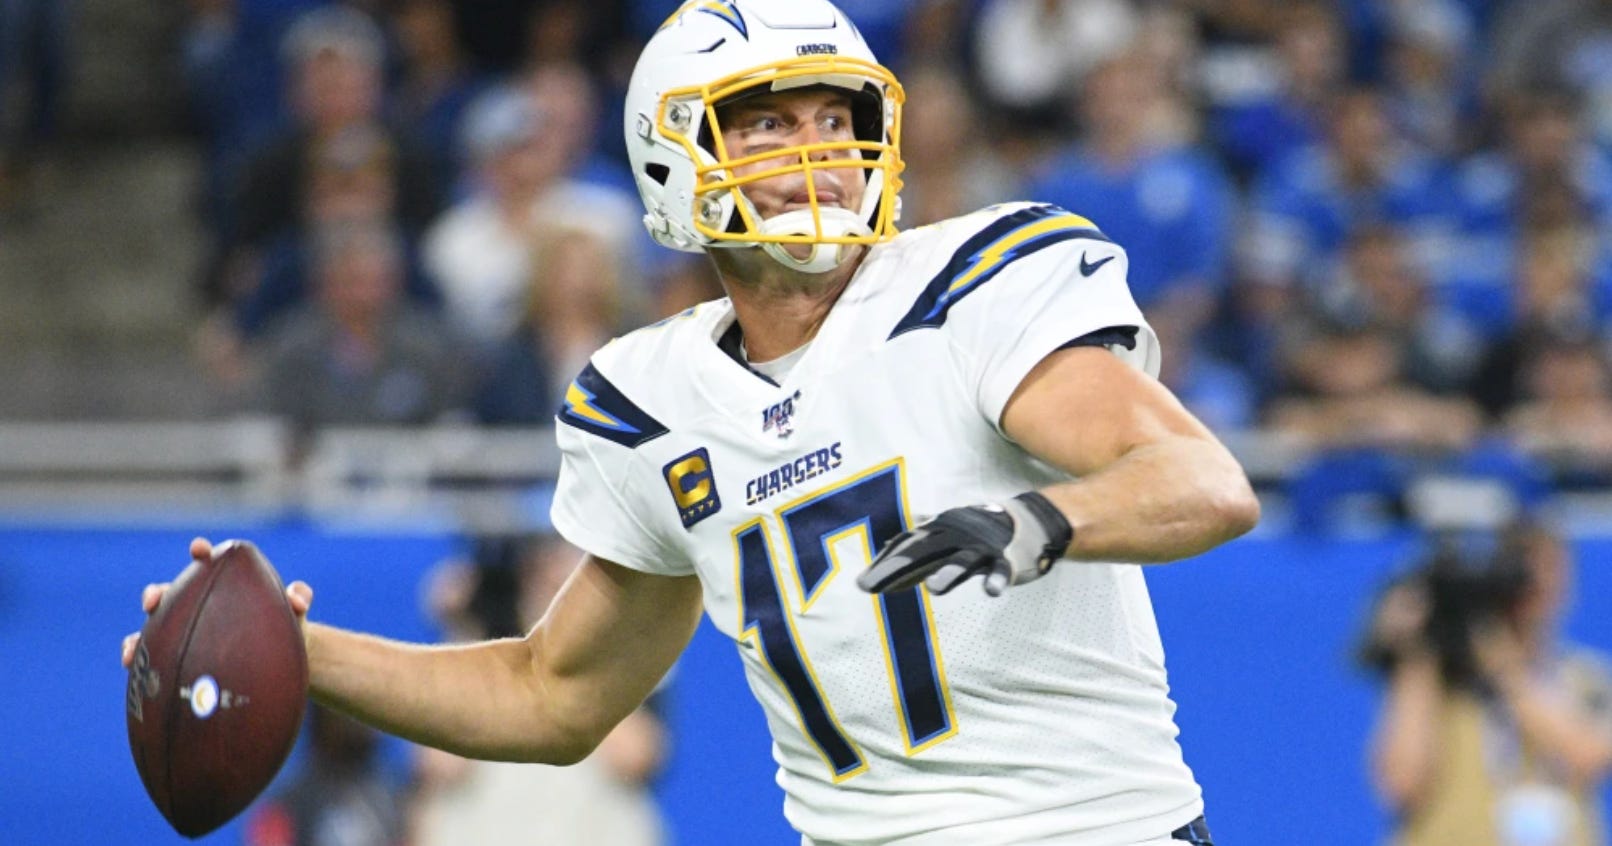
Great Players (35th): Chargers (Philip Rivers, Antonio Gates), Padres (Fernando Tatís)
San Diego only had the Chargers for 7 years of the 13, and the Padres have been one of the worst teams in baseball since 2010. The bottom line is that the Chargers and the Padres have rarely had memorable seasons or players. The Chargers went 9-7 in 2013 before getting bounced in the divisional round. As for the Padres, they’ve made the playoffs just twice in 13 years, and their only source of excitement has been Fernando Tatís and a recent trip to the NLCS.
35. Buffalo (45.12)
Bills, Sabres
Record (31st): Bills (108-101), Sabres (373-434-119)
Championships (36th): Bills (None), Sabres (None)
Great Seasons (30th): Bills (2020: 13-3, AFCG), Sabres (2022: 43-29-10)
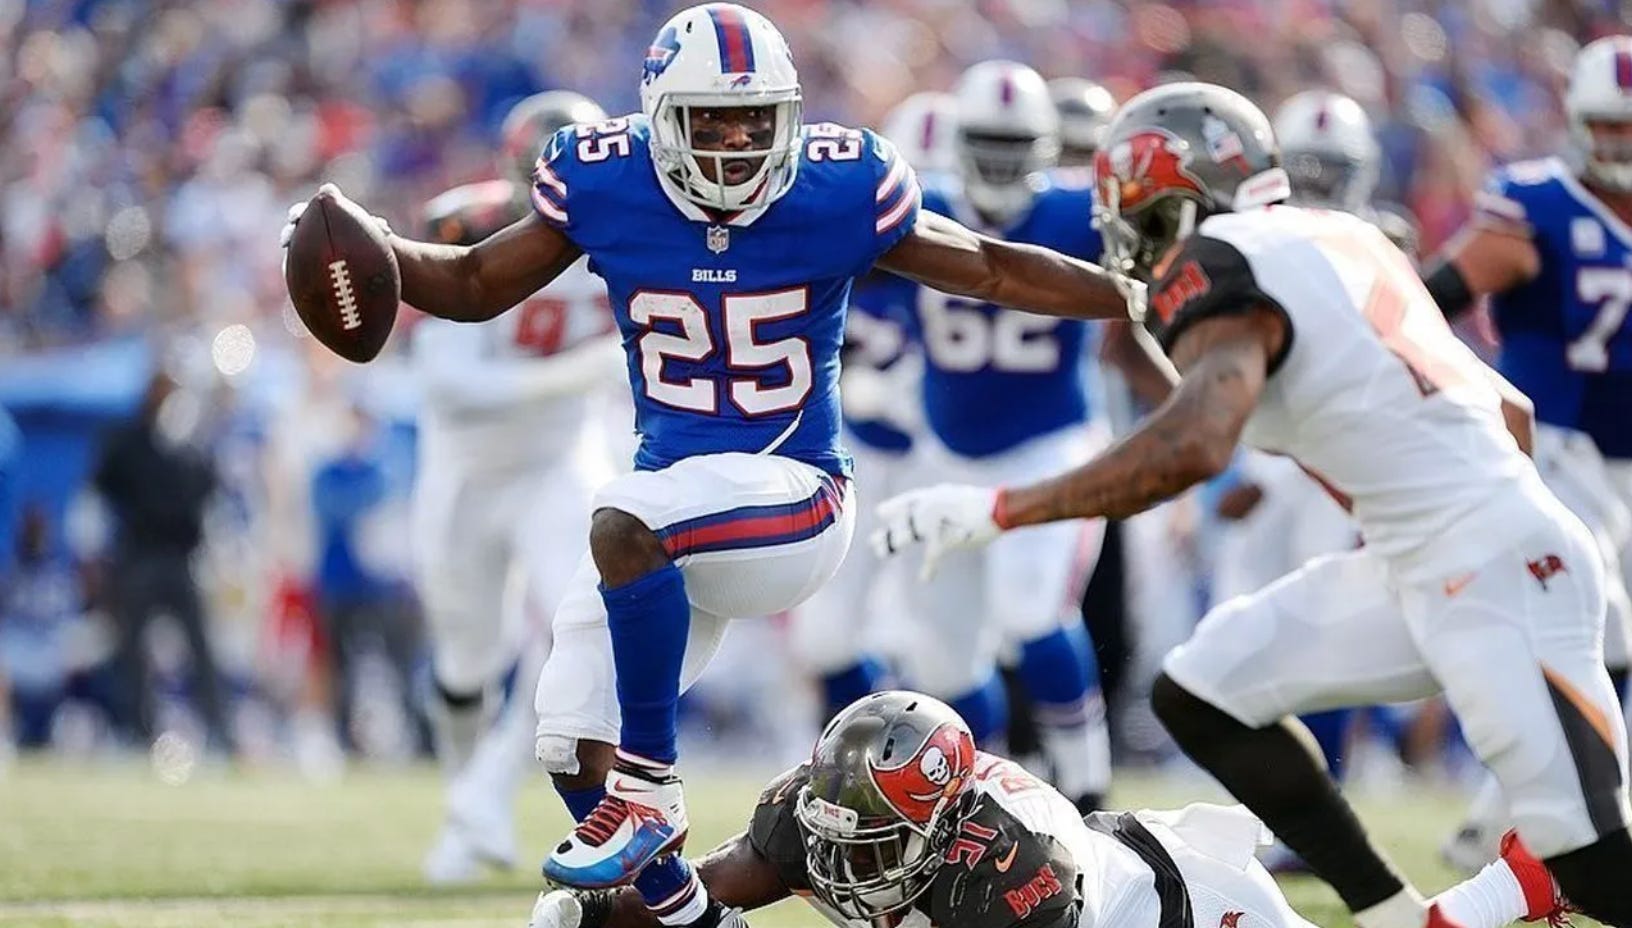
Great Players (34th): Bills (Josh Allen, Le’Sean McCoy), Sabres (Jack Eichel, Thomas Vanek)
The only success that has come out of Buffalo since 2010 has been the recent leap that the Bills have taken since drafting Josh Allen. Still, even with a winning record in the last thirteen years, the Bills has nothing to show for it, reaching the AFC championship game once, and losing 38-24. Don’t get my started on the Sabres. They haven’t made the playoffs in twelve years.
34. Indianapolis (45.83)
Pacers, Colts
Record (14th): Pacers (532-464), Colts (106-103-1)
Championships (34th): Pacers (None), Colts (None)
Great Seasons (33th): Pacers (2013: 56-26, 1 seed, made ECF), Colts (2012: 11-5, made playoffs)
Best Players (33th): Pacers (Paul George, Victor Oladipo), Colts (Andrew Luck, T.Y. Hilton)
The Pacers and the Colts have both been solid regular season teams, reaching the playoffs a combined 15 times in 26 seasons. The issue is, it’s been difficult for them to take the next step. They’re 6-9 in first rounds, and 0-3 in conference finals. Paul George’s departure in 2017, Andrew Luck’s retirement, and Victor Oladipo and T.Y Hilton’s injuries certainly didn’t do Indianapolis any favors either.

33. New Jersey (46.98)
Jets, Giants, Devils, Nets
Record (36th): Jets (81-129), Giants (89-120-1), Nets (46-102), Devils (417-428-126)
Championships (19th): Jets (None), Giants (2011), Nets (None), Devils (None)
Great Seasons (34th): Jets (2015: 10-6), Giants (2022: 9-7-1, SB), Nets (2011: 22-44), Devils (48-28-6, made finals)
Best Players (32th): Jets (Darrelle Revis), Giants (Odell Beckham Jr, Saquon Barkley), Nets (None), Devils (Taylor Hall)
The Jets and the Giants playing their football in New Jersey has made the place a massive black hole of losing. They have by far the worst win percentage of any city of 0.429, and have only logged 12 winning seasons in 41 attempts. This means they also have a lack of great, notable seasons. Eli Manning’s heroics in the 2011 Super Bowl saved New Jersey from landing in last place on this list.

32. Detroit (47.12)
Pistons, Lions, Tigers, Red Wings
Record (35th): Pistons (381-609), Lions (89-119-2), Tigers (949-1051), Red Wings (440-434-135)
Championships (29th): Pistons (None), Lions (None), Tigers (None), Red Wings (None)
Great Seasons (29th): Pistons (2015: 44-38, R2), Lions (2011: 10-6, playoffs), Tigers (2012: 88-74, WS), Red Wings (2010: 47-25-10, R2)
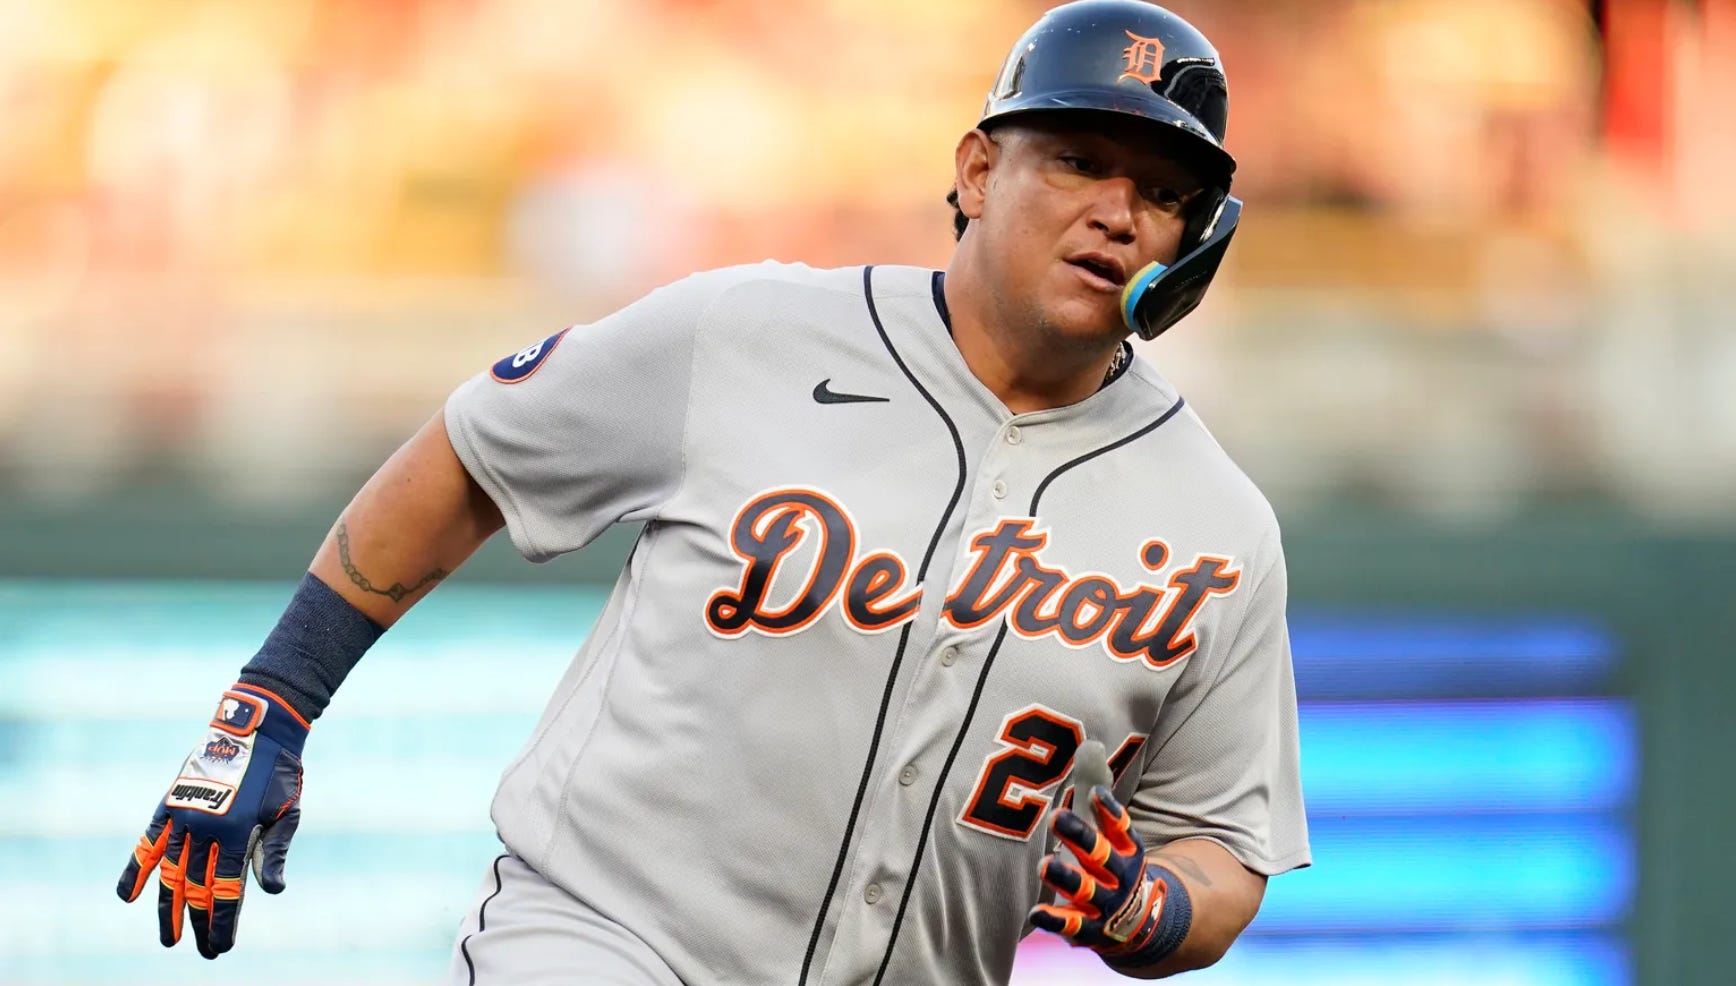
Best Players (23rd): Pistons (Andre Drummond), Lions (Matthew Stafford), Tigers (Justin Verlander, Miguel Cabrera), Red Wings (Pavel Datsyuk, Henrik Zetterberg)
It’s hard to fathom a city with four teams this low on the list. However, like New Jersey, Detroit does a whole lot of losing. In 2019, the Pistons, Lions, Tigers, and Red Wings finished 5th to last, 3rd to last, last, and last in their respective leagues. Not even a couple of future Hall-Of-Famers in Justin Verlander and Miguel Cabrera can make-up for the losing and the Tigers’ loss to San Francisco in the 2012 World Series.
31. Anaheim (47.71)
Angels, Ducks
Record (7th): Angels (516-456), Ducks (474-361-122)
Championships (31st): Angels (None), Ducks (None)
Great Seasons (28th): Angels (2014: 98-64, ALDS), Ducks (51-24-7, CF)
Great Players (30th): Angels (Mike Trout, Albert Pujols), Ducks (Ryan Getzlaf #35, Corey Perry #36)
The Angels lived in Anaheim from 2010-2015 and didn’t win a single playoff game despite Mike Trout winning his first MVP in 2014. The opposite goes for the Ducks, who gave Anaheim some life with two conference finals appearances in 2014 and 2016, but haven’t sniffed the playoffs for five years. The lack of star-studded rosters for the Ducks has also hurt Anaheim.

30. New Orleans (47.88)
Pelicans, Saints
Record (18th): Hornets/Pelicans (441-553), Saints (128-82)
Championships (32nd): Hornets/Pelicans (None), Saints (None)
Great Seasons (31st): Hornets/Pelicans (2017: 46-36, R2), Saints (2018: 13-3, 1 seed, CG)
Best Players (20th): Hornets/Pelicans (Anthony Davis, Brandon Ingram), Saints (Drew Brees, Michael Thomas, Marques Colston)
If these rankings were from 2009 to 2023, New Orleans would be in business, but the Saints led by Drew Brees didn’t do enough winning after 2010 to make it out of the lower quartile. The Saints best chance was the NFL championship game against the Rams in 2018 when they lost in overtime, and the Pelicans have only squeaked into the playoffs on occasion. However, New Orleans ranking is brought up because of their two future Hall-Of-Famers in Drew Brees and Anthony Davis.
29. Brooklyn/Queens (47.94)
Nets, Mets, Islanders
Record (26th): Nets (397-448), Mets (997-1007), Islanders (465-380-120)
Championships (25th): Nets (None), Mets (None), Islanders (None)
Best season (32nd): Nets (2020: 48-24, 2 seed), Mets (2015: 90-72, made World Series), Islanders (2020: 32-17-7, CF)
Best Players (27th): Nets (Brook Lopez, Kevin Durant), Mets (Jacob DeGrom, David Wright), Islanders (John Tavares)
Not one of these three franchises ever got serious about winning. The Nets seem to make more splashy trades and signings than win playoff games. Their only source of success is the Islanders five playoff appearances in six years, the Mets’ win in game 3 of the 2015 World Series, and a few lights out seasons from Jacob DeGrom and Kevin Durant.

28. Las Vegas (48.08)
Raiders, Golden Knights
Record (4th): Raiders (24-26), Golden Knights (267-147-41)
Championships (23rd): Raiders (None), Golden Knights (2022)
Great Seasons (35th): Raiders (2021: 10-7, made playoffs), Golden Knights (51-22-9, 1 seed, SC)
Great Players (36th): Raiders (Maxx Crosby, Davante Adams), Golden Knights (Marc-Andre Fleury #42, Jack Eichel)
Las Vegas is a very interesting case. They’ve won a lot. They’ve got the makings of being a great sports city with new teams potentially coming, and the meteoric rise of the Golden Knights. However, they just haven’t been on the scene for long enough. Thus, they’ve only owned Davante Adams for a season, and can’t even boast being Jack Eichel’s main team fro mover the years. Give them another decade and they’ll be in a great spot.

Thanks for reading. Part two is coming your way on the 9th. Stay tuned!
"The Jets and the Giants playing their football in New Jersey has made the place a massive black hole of losing." ... Not pulling any punches, I see.